Redesigning Graph API
My role / tasks
Product designer
Duration
1 Month
Team
1 Designer / 2 Developers
Redesigning Graph API
My role / tasks
Product designer
Duration
1 Month
Team
1 Designer / 2 Developers
Redesigning Graph API
My role / tasks
Product designer
Duration
1 Month
Team
1 Designer / 2 Developers
Problem
Problem
Users are only able to create and implement graphs, there is no way to store, manage and customize existing ones
Users are only able to create and implement graphs, there is no way to store, manage and customize existing ones

Discovery
Discovery
Let's it down further
Let's it down further
Whilst trying out the product I found a couple of problems that may effect with users experience, so I made a flow of how users should flow through the product and found that Graph API wasn't as straight forward as it was meant to be, to validate these problems, I did a usability test asking users to walk me through how they would use Graph API in the end we found that:
Whilst trying out the product I found a couple of problems that may effect with users experience, so I made a flow of how users should flow through the product and found that Graph API wasn't as straight forward as it was meant to be, to validate these problems, I did a usability test asking users to walk me through how they would use Graph API in the end we found that:


Tasks
Tasks
Implement a way for users to store, manage and customize existing graphs
Let users know what are the next steps after generating the graph
Implement a way for users to store, manage and customize existing graphs
Let users know what are the next steps after generating the graph
Contraints
Contraints
Stakeholder would like to keep the existing feature (chatbot) as the way for people to create graphs
Stakeholder would like to keep the existing feature (chatbot) as the way for people to create graphs
Ideation - problem 1
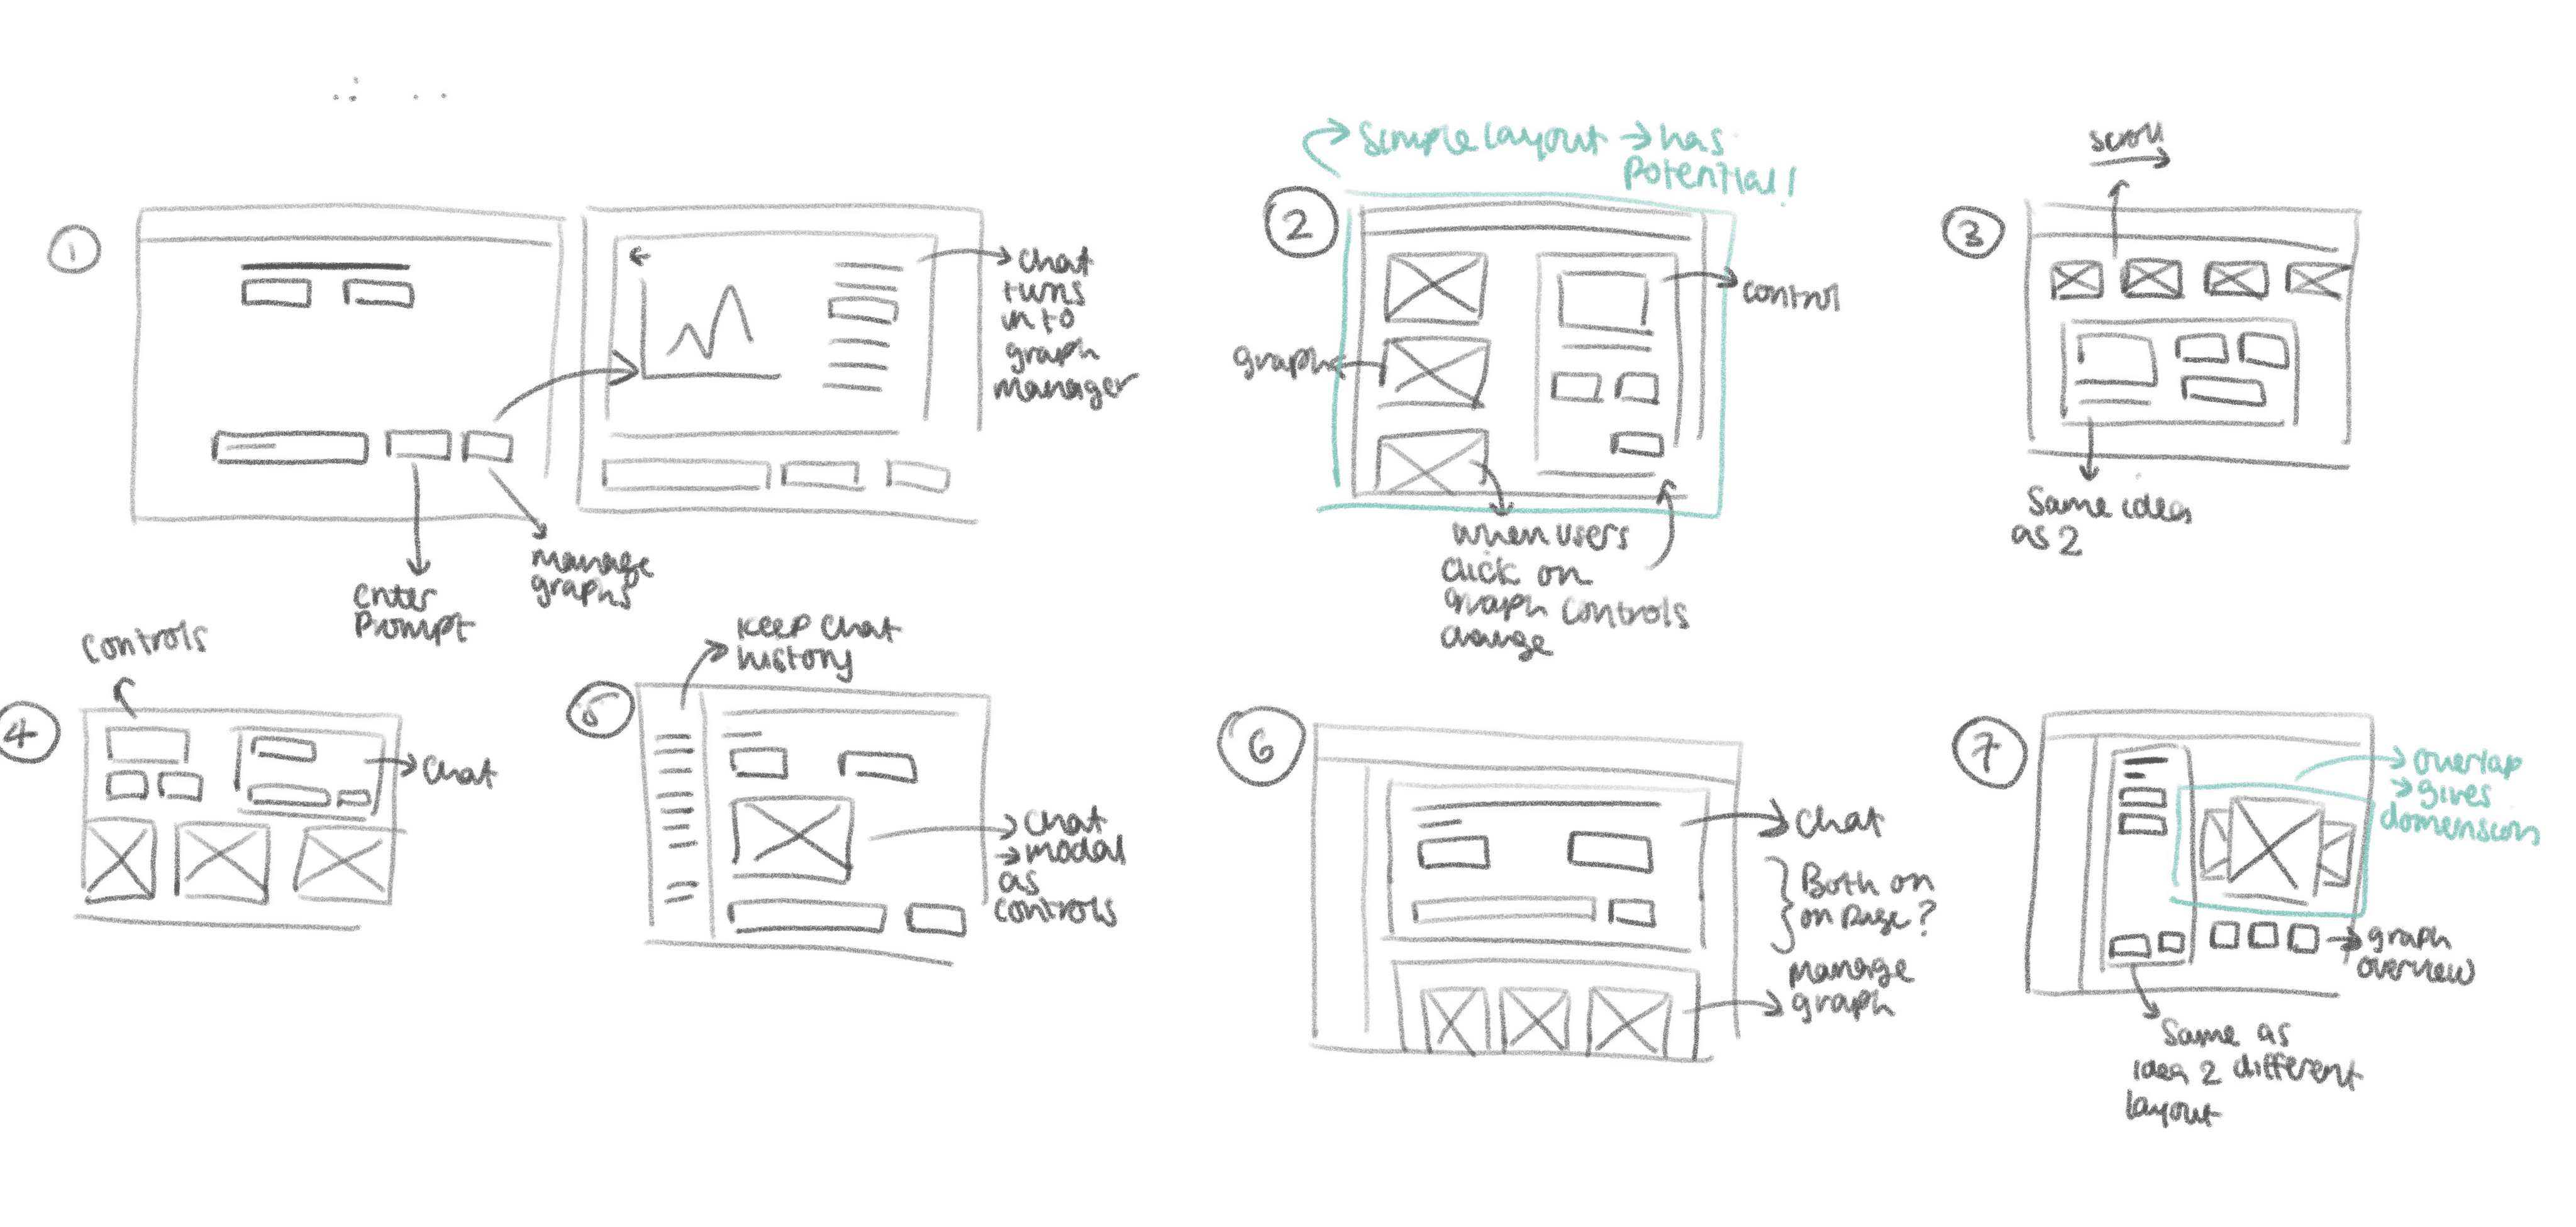
How can users to manage existing graphs?
I sketched out as many solutions as possible. In end we settled with this design as it was the most straight forward solution. The idea was to have 2 screens, a place where users can create graphs (using the chat bot) and a place for them to manage existing ones
Ideation - problem 2
How might we implement instructions for next steps?
I made a couple of low-fidelity designs on how the instructions can be implemented, focusing on simplicity, I realised that there is no need to users to actually see the URL, they just need to copy it

Ideation - problem 3
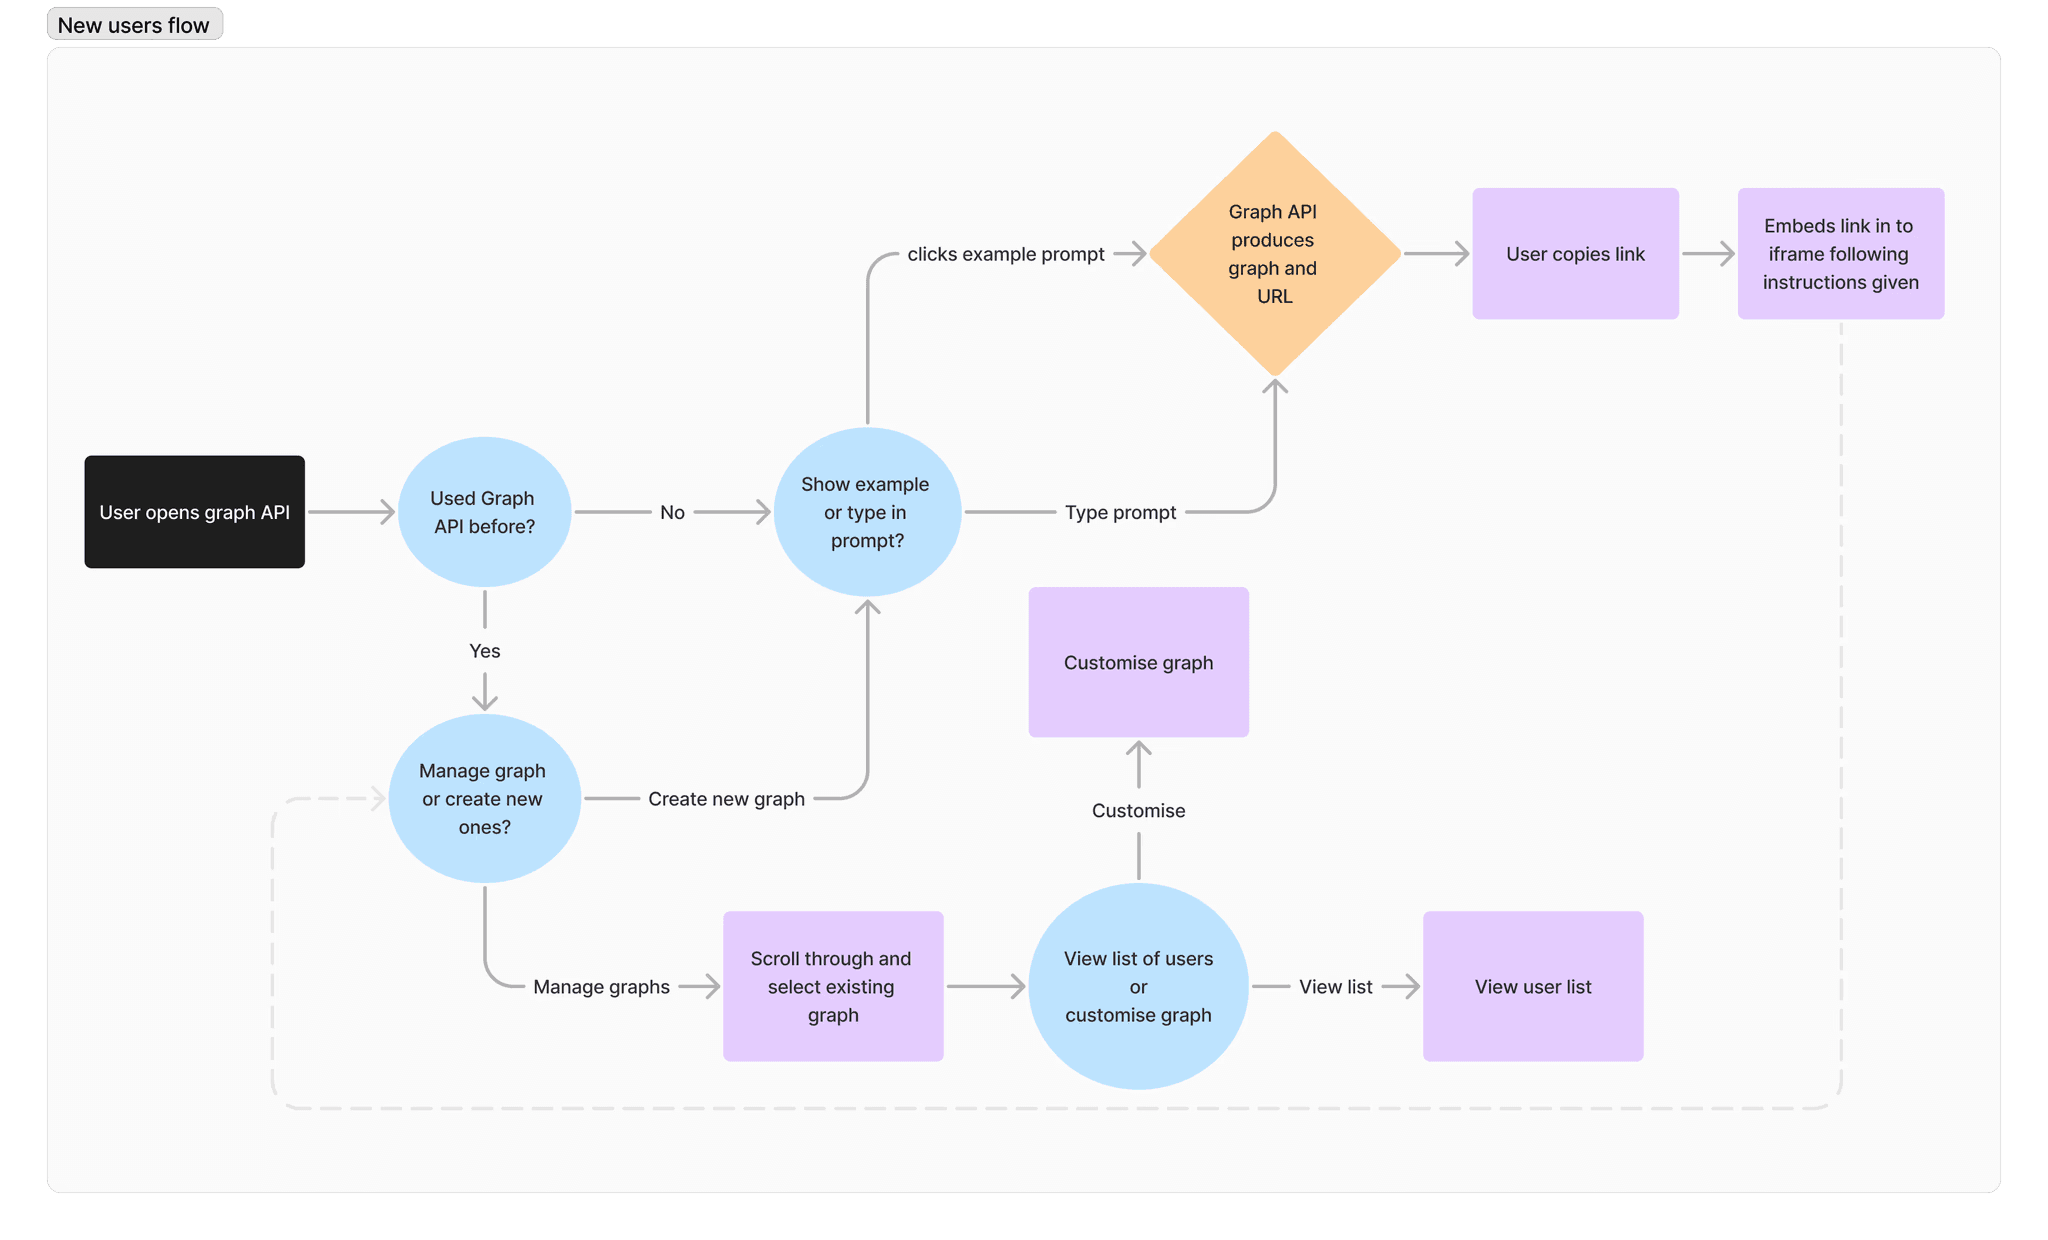
Does it fit in our exisiting journey?
I then recreated the user flow to accomodate for the new feature. By mapping out the key moments in the user's journey, which it ensures that I do not neglect any vital steps in the flow
Validate
Validate
Stakeholder and Engineer feedback
Stakeholder and Engineer feedback
Stakeholders emphasised the importance of compressing features to a single screen to streamline user tasks. Upon discussing with developers, it became clear that the complex interactions and design elements hindered development progress.
Stakeholders emphasised the importance of compressing features to a single screen to streamline user tasks. Upon discussing with developers, it became clear that the complex interactions and design elements hindered development progress.
✅
✅
In response to feedback, I integrated the chatbot and graphs while simplifying the design. Graph management and customisation were changed to pop-ups.
In response to feedback, I integrated the chatbot and graphs while simplifying the design. Graph management and customisation were changed to pop-ups.
FINAL DESIGN
FINAL DESIGN
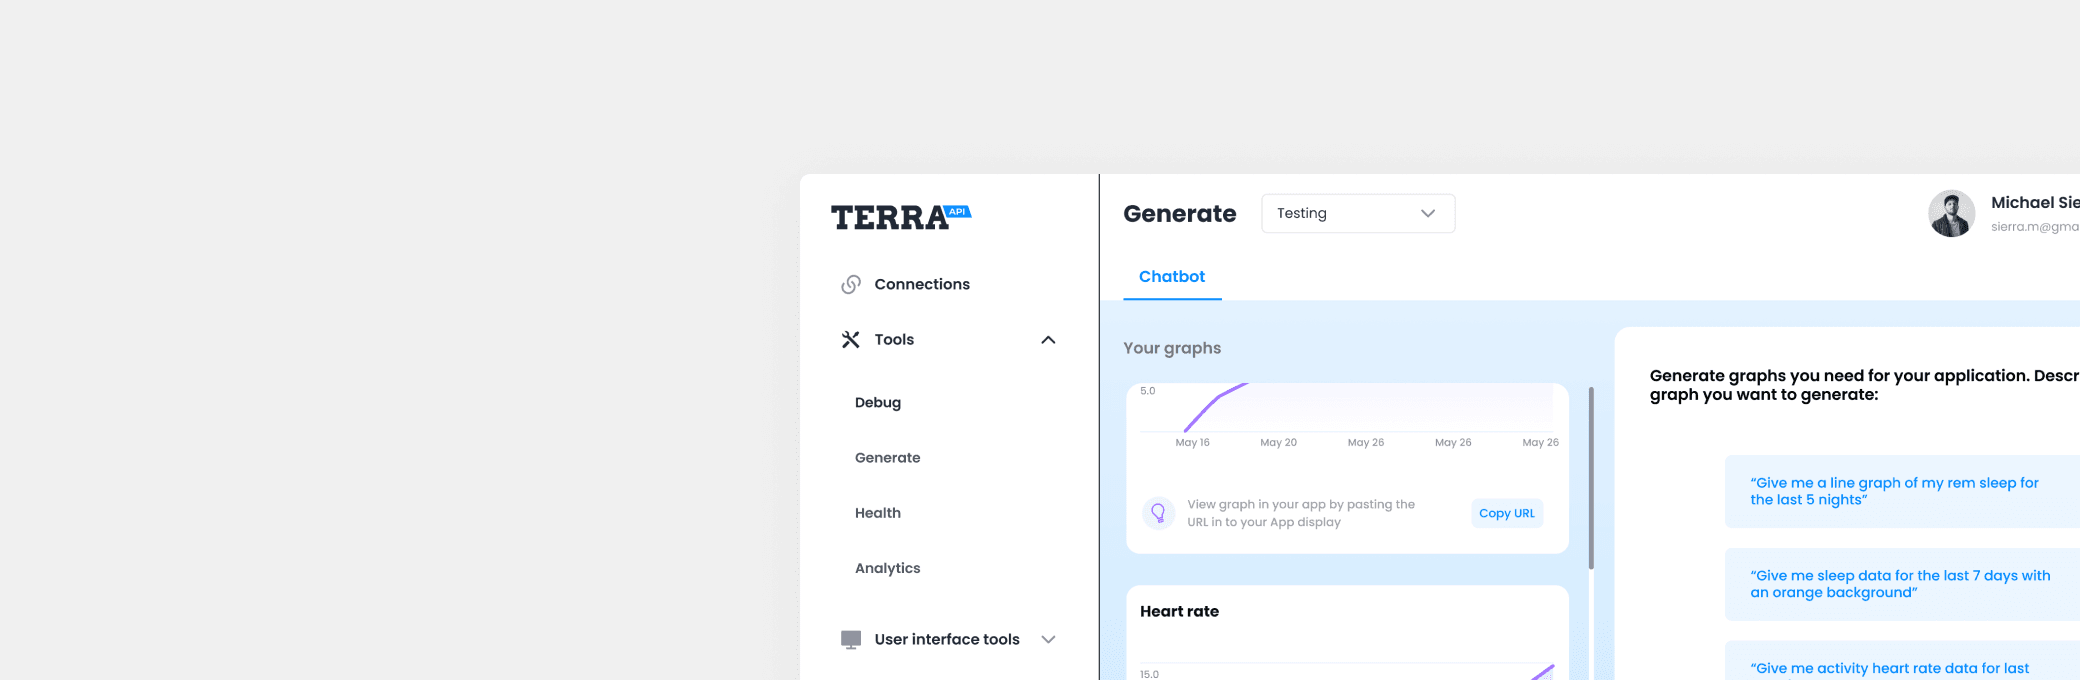
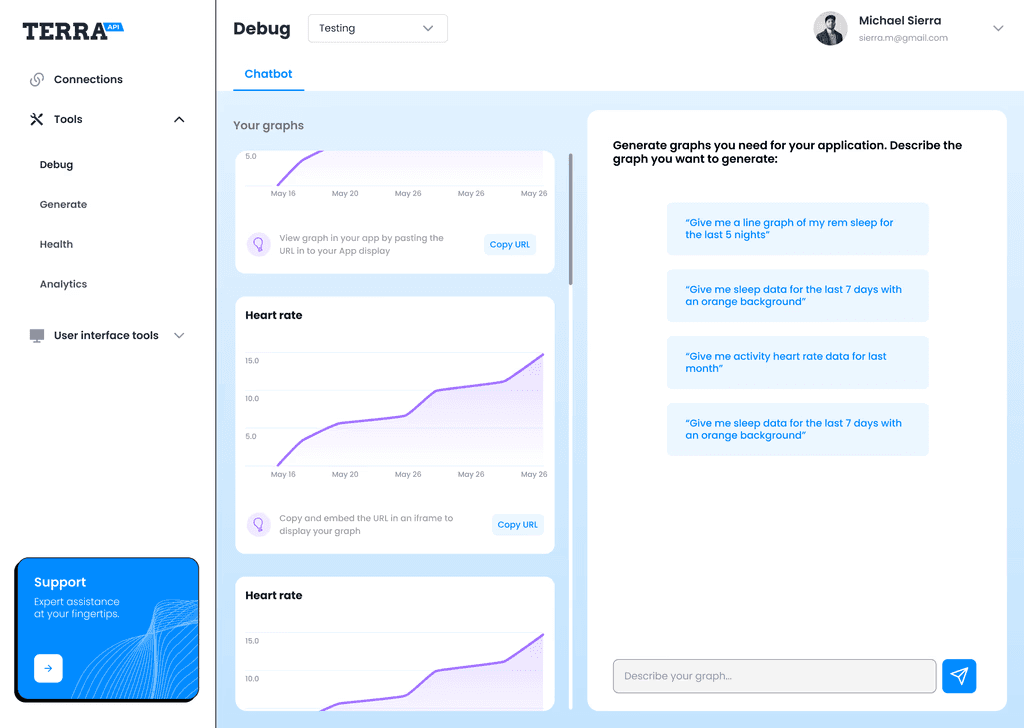
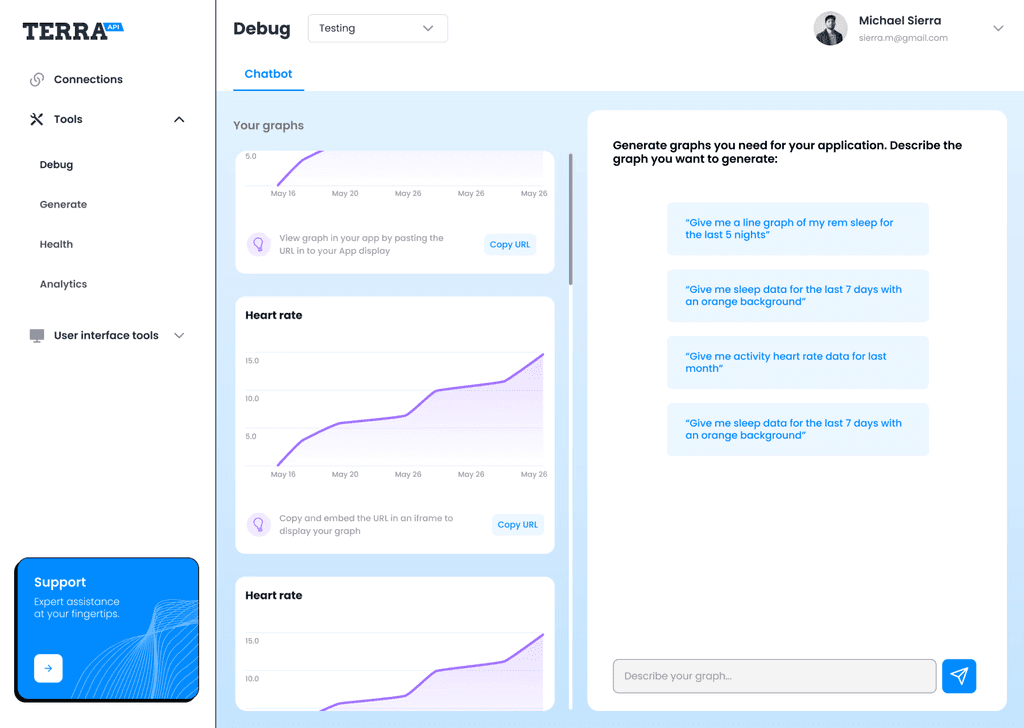
Create and Manage existing graph
Create and Manage existing graph
As a solution to our pain points, users can create new graphs using the chatbot on the right and manage existing ones on the left.
Instead of showing users the embedded code and URL, I've provided instructions on how to integrate the graphs
As a solution to our pain points, users can create new graphs using the chatbot on the right and manage existing ones on the left.
Instead of showing users the embedded code and URL, I've provided instructions on how to integrate the graphs

FINAL DESIGN
FINAL DESIGN
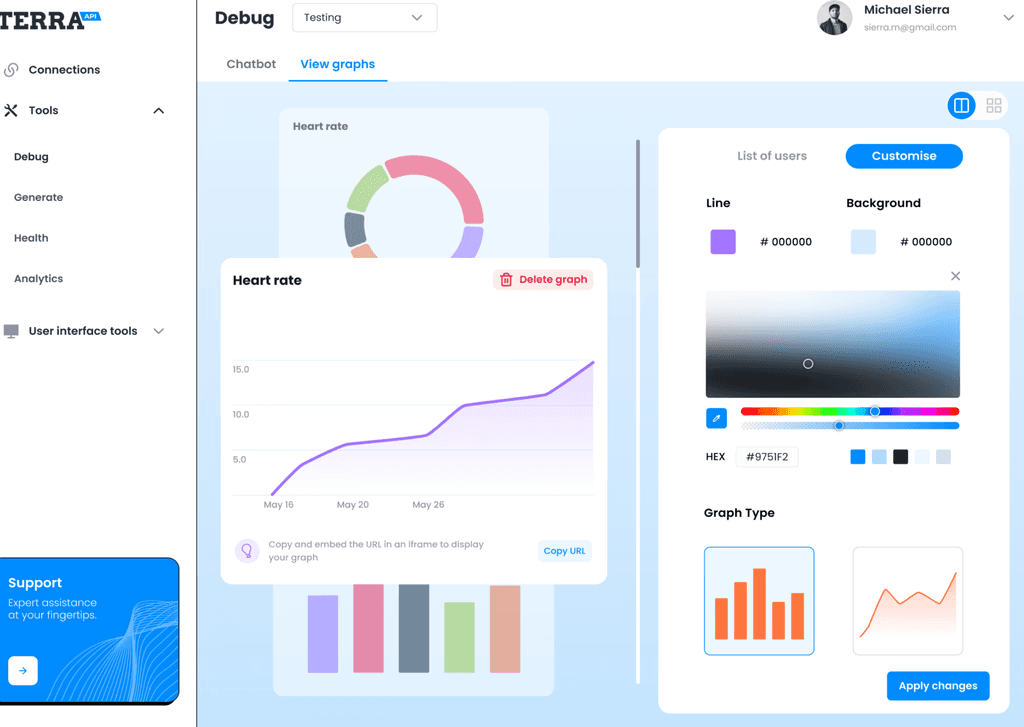
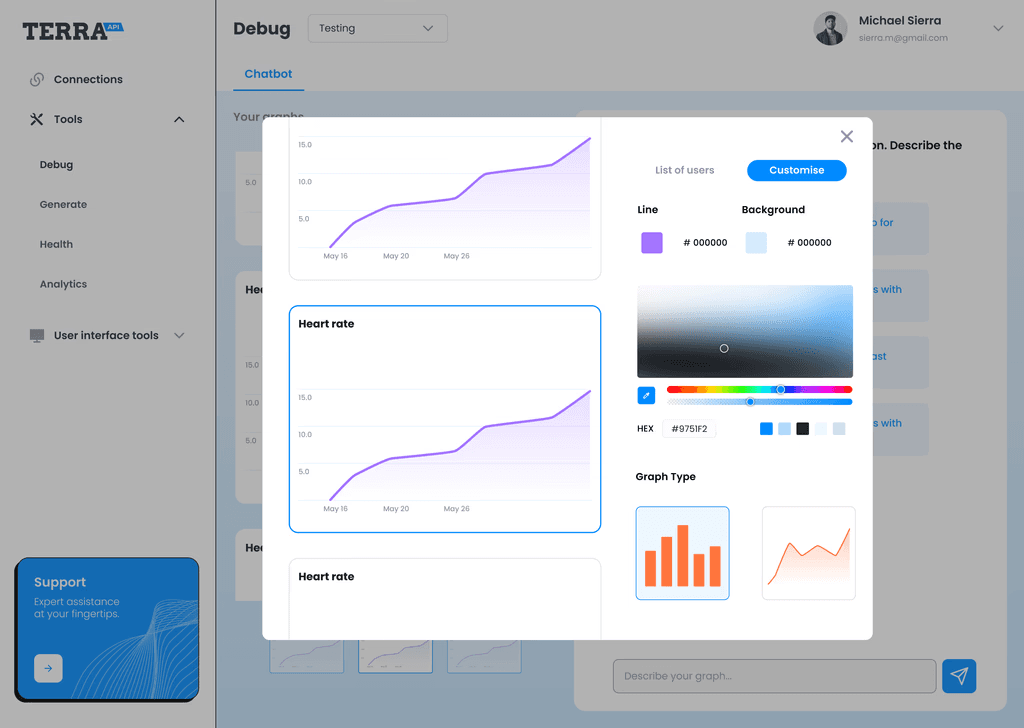
Edit graphs in a few clicks
Edit graphs in a few clicks
Users can change the graph type and colors occording to their own liking
Users can change the graph type and colors occording to their own liking
FINAL DESIGN
FINAL DESIGN
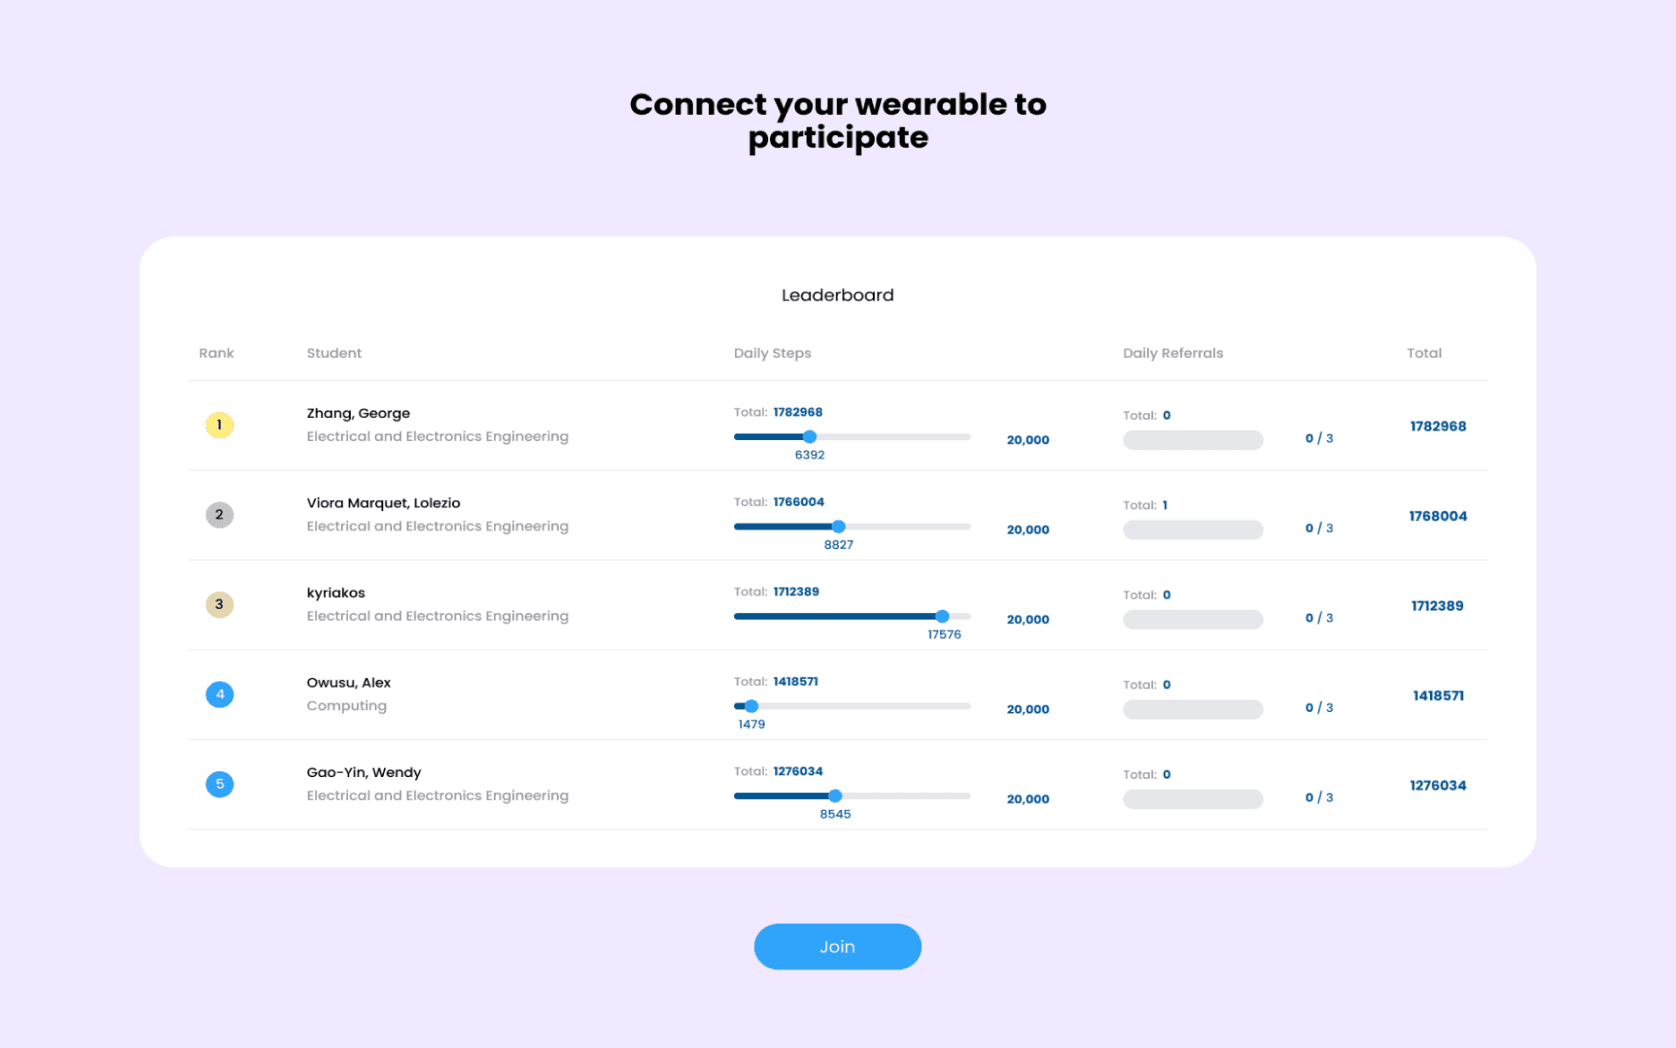
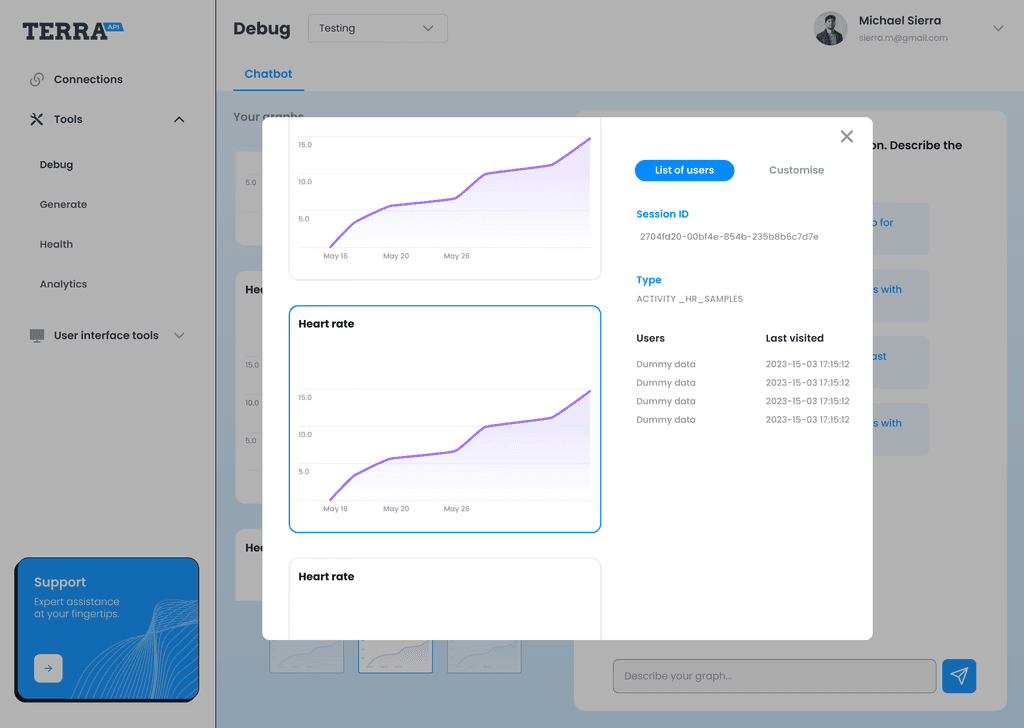
Keep track of your users activity
Keep track of your users activity
Users can also keep track of their users activity by tracking how often their users view these graphs
Users can also keep track of their users activity by tracking how often their users view these graphs
IMPACT
IMPACT
98%
98%
User said they the new design was simple easy to articulate
User said they the new design was simple easy to articulate
100%
100%
Users were happy with the new features and found them useful
Users were happy with the new features and found them useful
95%
95%
Users were able to complete the entire user journey including adding the URL to their frame
Users were able to complete the entire user journey including adding the URL to their frame
I learned
I learned
Empty states
Empty states
As this is a new feature, making sure to include empty states in your designs are crucial. It was something I almost neglected doing if it weren't for creating the new users flow.
As this is a new feature, making sure to include empty states in your designs are crucial. It was something I almost neglected doing if it weren't for creating the new users flow.
Next time
Next time
More research
More research
Due to time constraint I was not able to as much research as I would have liked, although our stakeholder was happy with the final design.
Due to time constraint I was not able to as much research as I would have liked, although our stakeholder was happy with the final design.
Allowing for more personalisation to the graphs
Allowing for more personalisation to the graphs
As our customers are other businesses, allowing them to be able to customize graphs to their branding is important, allowing for more personalisation is something I would like to implement
As our customers are other businesses, allowing them to be able to customize graphs to their branding is important, allowing for more personalisation is something I would like to implement
© 2025 by Caroline Sia Made with ❤️🍵
© 2025 by Caroline Sia Made with ❤️🍵
© 2025 by Caroline Sia Made with ❤️🍵
Ideation - problem 1
How can users to manage existing graphs?
I sketched out as many solutions as possible. In end we settled with this design as it was the most straight forward solution. The idea was to have 2 screens, a place where users can create graphs (using the chat bot) and a place for them to manage existing ones
Ideation - problem 2
How might we implement instructions for next steps?
I made a couple of low-fidelity designs on how the instructions can be implemented, focusing on simplicity, I realised that there is no need to users to actually see the URL, they just need to copy it
Ideation - problem 2
Does it fit in our exisiting journey?
I then recreated the user flow to accomodate for the new feature. By mapping out the key moments in the user's journey which it ensures that I do not neglect any vital steps in the flow
